Top 6 DevOps Metrics and KPIs to Improve Your Business Performance

Learn about the top 6 DevOps metrics and KPIs to apply in your business for improved code quality, software security, and production cost-efficiency.

Related services

Top 6 DevOps Metrics and KPIs to Improve Your Business Performance

The “you can’t improve what you can’t measure” rule fully applies to DevOps. About 95% of Atlassian’s 2020 DevOps Trends Survey responders find it critical to measure DevOps success. Meanwhile, over 54% lack an effective way to gauge progress based on DevOps metrics and KPIs. In addition, more than 39% aren’t sure how to use these metrics to further their organization’s goals.

Leading DevOps companies measure wisely. They ignore vanity metrics that indicate basic capability but fail to show genuine issues or how effective the processes really are. You should follow their lead and focus on metrics that will bring the most value to your business. Does it sound too abstract? Wait a little bit, and we’ll show you the real metrics that you may want to start measuring

This article will tell you about KPIs that can accurately measure DevOps progress and help you refine your processes. We’ll also share practices that could help you collect metrics effectively across your production environment.

What are the DevOps metrics?

DevOps metrics are data points that demonstrate how your development pipeline performs. They let you evaluate your tech capabilities, assess the quality of collaboration workflows, and uncover inefficiencies in your processes.

DevOps is a complex methodology—and its assessment is no less complex. Ideally, you should use high-quality metrics characterized by:

●       Measurability — the values should be consistent and standardized, so you can measure progress over time

●       Actionability — you should be able to apply this data to improve your collaboration workflows and techniques

●       Traceability — these metrics should help you find the root causes of bottlenecks and inefficiencies

●       Reliability — you should be able to verify the authenticity of your findings to prevent any tampering with measurements

●       Relevancy — the data should provide important business insights

Observability and continuous improvement are the basics of DevOps, and the same is true for its metrics. So, what are the most important things to measure?

Top 6 DevOps metrics and KPIs

The 2020 DevOps Trends Survey shows that over half of responders leverage DORA metrics. These DevOps metrics include deployment frequency, lead time for changes, mean time to recovery, and change failure rate.

But these four indicators do not cover all aspects of your DevOps initiatives. That's why we added some extra measurements to our list.

Deployment frequency

Deployment frequency (DF) shows how often you deploy the code to production or release it to end users. This metric is used to gauge the efficiency of your DevOps engineers and operations teams. Some companies also include delivery frequency, which measures how often your team releases code changes into a pre-production staging environment.

deployment frequency

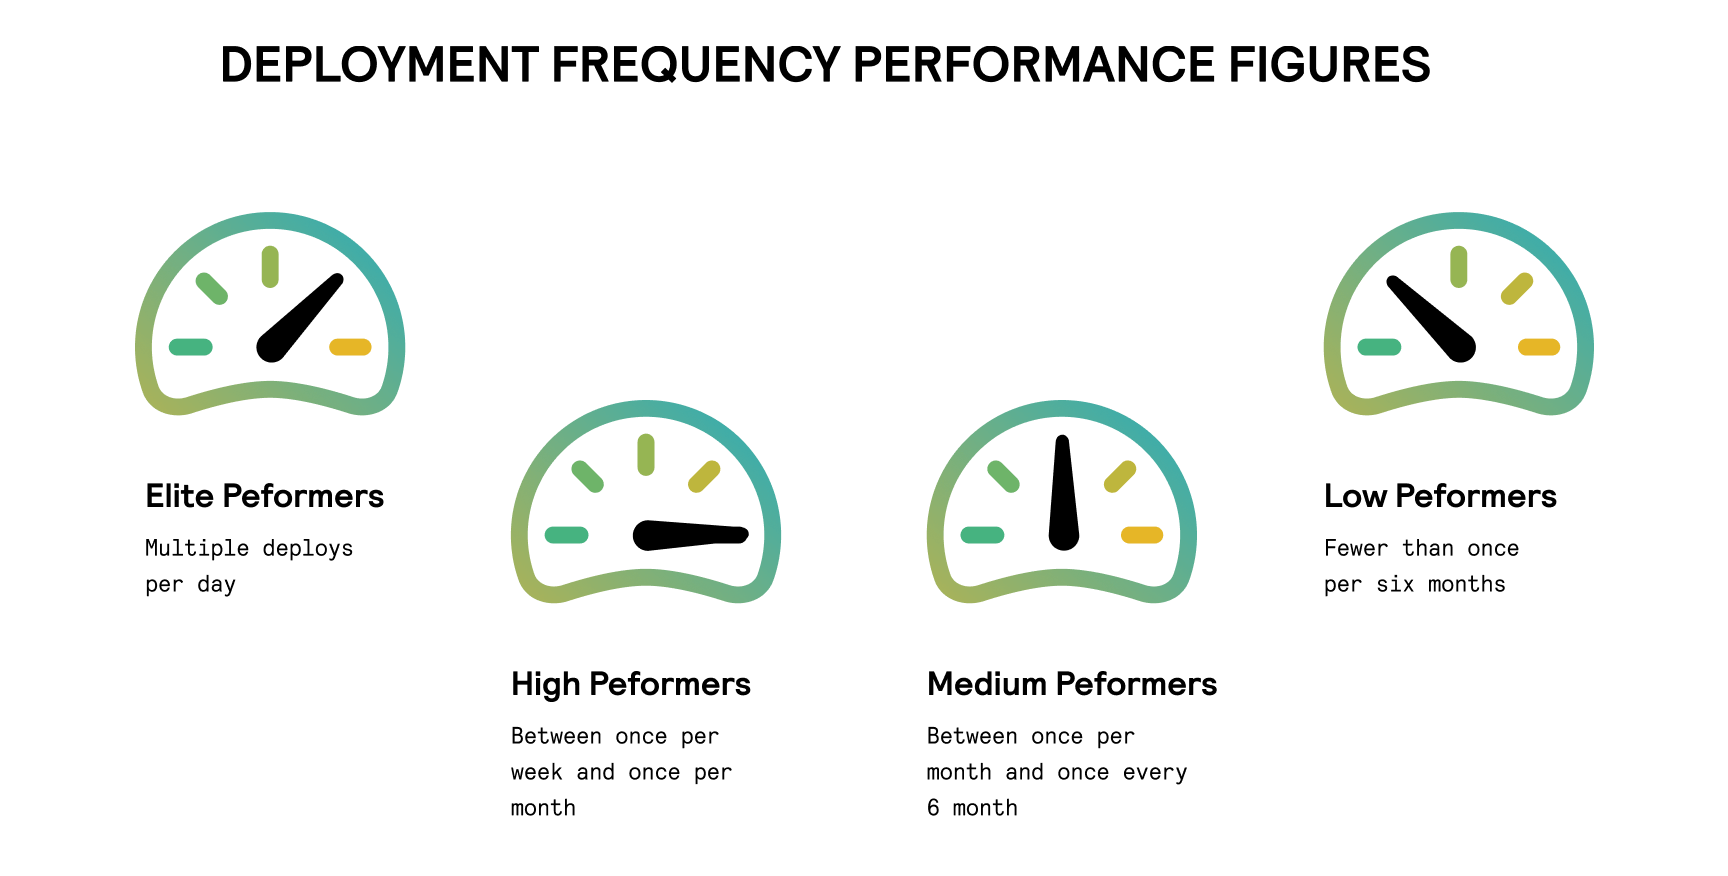
The best practice is to deploy code consistently in smaller batches. This leaves less room for error and makes it easier to identify bugs before they escalate. According to Accelerate’s 2021 State of DevOps Report, top teams deploy code multiple times a day (or around 1,460 times per year). DFP in less efficient teams can range from once a month to a single deployment every six months.

To measure DFP accurately, you first need to define a successful deployment. For example, you may need to adjust the DevOps metrics dashboard to factor in all operational deployments or those generating a specific amount of traffic.

If we put aside giants like Etsy or amazon, with dozens deployments per day. As it was said before - the most frequent scenarios are to deploy once a day on average. It’s also needed not for the speed of delivery. But to eliminate fear of your engineers to deploy so often

Lead time for changes

Lead time for changes (LT) is a DevOps metric that measures the velocity of software delivery. It shows how long your team implements, tests, and delivers code after committing to a code change.

lead time for changes

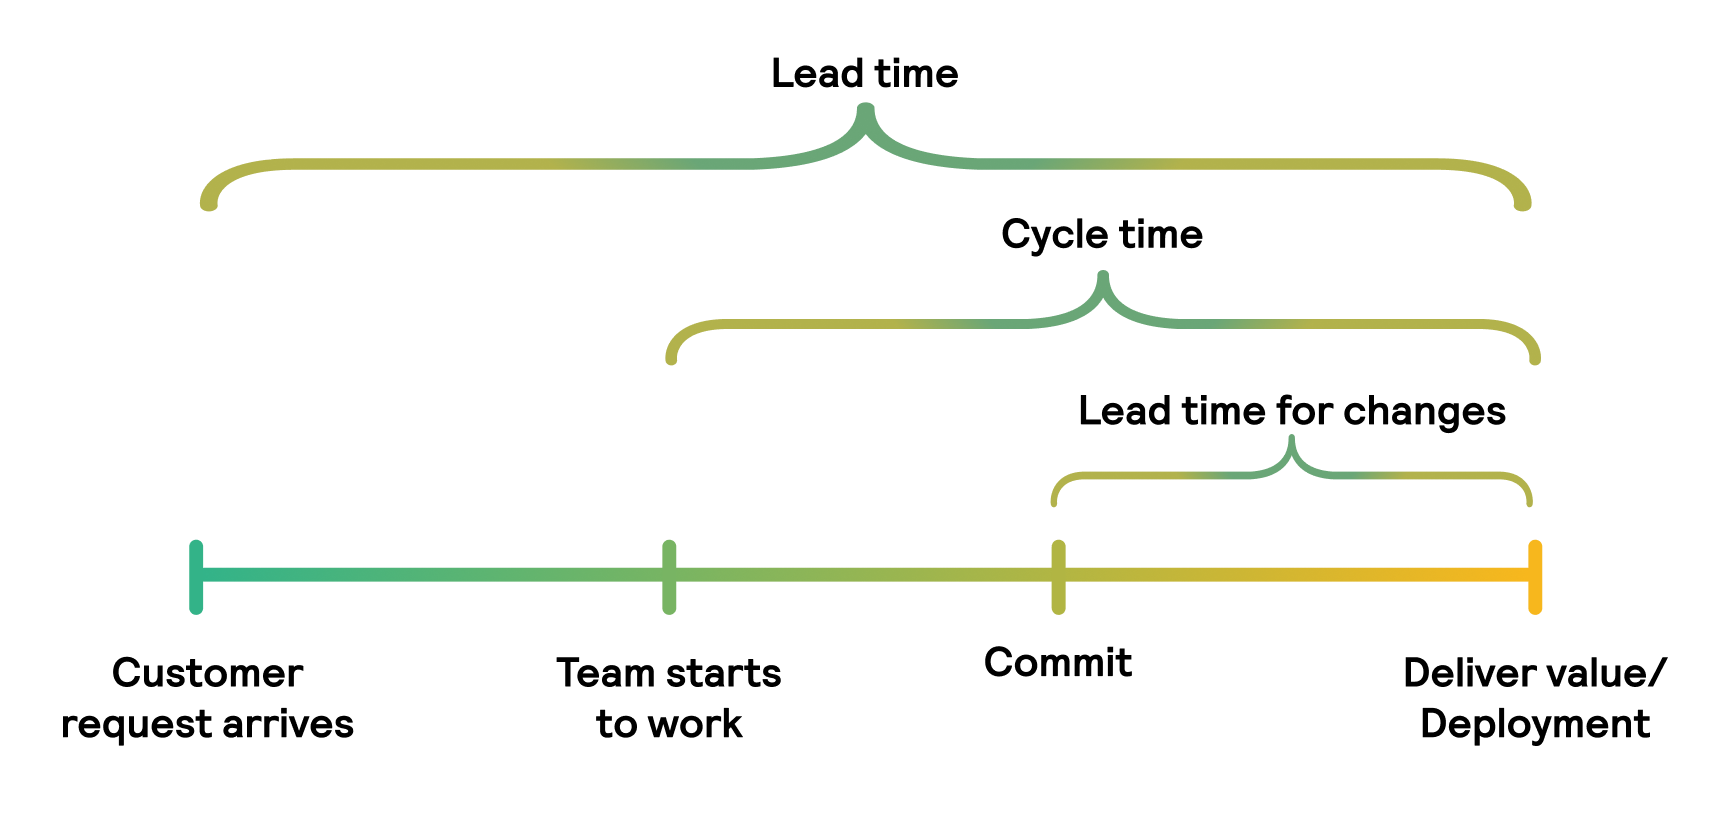
Elite DevOps practitioners strive to change code in less than an hour. But in most cases such often releases are not necessary and require huge budgets to be spent on this direction. High-performing teams spend from one day to one week delivering a successful production change. Longer lead times may indicate that developers work on separate branches and neglect DevOps automation tools for testing and quality control.

Recording the start and the end of any code changes is crucial to gauge these metrics properly. You should also measure the volume of changes for deployments, so you can focus only on impactful updates that affect your business performance.

Change failure rate

Change failure rate (CFR) is the percentage of code changes that need hotfixes, rollbacks, patches, or other remediations. To calculate it, you must divide the number of deployment failures by the total number of deployments. However, it doesn’t account for failures your team detects and fixes before deploying code. This metrics allows you to understand how much effort you need to put into your testing capabilities and how comfortable your engineers are with deploying the code even if it may have issues in the early stages.

Unlike other DevOps metrics and measurements that show software delivery speed, CFR lets you understand the quality of your end product. Lower rates mean that your teams can identify bugs early in development, which equals less money and time spent to fix them. To earn a badge of an elite DevOps team, try to keep the change failure rate below 15%.

Defect escape rate

The defect escape rate helps you understand how many bugs make it to end-users. To measure it, you must divide the number of bugs found in production by the total number of bugs found during the entire software development life cycle.

This metric reveals cracks in your development pipeline. It is also tightly linked to end-user satisfaction rates, as a significant portion of issues will be detected by analyzing user feedback and customer support tickets.

This measurement also helps companies put things into perspective. You might think that finding fifteen bugs after deployment is way too much. But it may be a good result if that’s only 2% of all issues found during the development.

If you combine this metric and LT metric, it will be interesting to see the corelation between faster releases and how much more or less errors (usually more) sneak into release. If you have additional budget, or in case you are Head of Engineering and want to have some arguments for your financial deparment about why you need ot switch from manual to automated testing, or why you need invest more into testing - this may be very useful for you.

Mean time to recovery

Mean time to recovery (MTTR) shows how fast you bounce back from partial service interruptions and total system failures. To calculate it, take the time it took you to fix the bugs and divide it by the number of issues fixed in a given period.

Shorter MTTR encourages engineers to experiment and eliminates fear of making changes. It usually takes DevOps professionals less than a day to fix an issue, whereas top performers can restore services in under an hour. Remember we mentioned resiliency in previous metrics? That’s what we meant.

Your ability to fix issues depends on how fast you can detect them. That’s why nearly 50% of DevOps professionals use up to five monitoring tools, based on GitLab’s 2021 DevSecOps Survey. Additionally, 72% prefer software that feeds developers and operations teams with real-time metrics.

Engineering reliability

Engineering reliability measures operational performance, system availability, network latency, and application performance index. It shows that your teams can meet your business goals and user expectations.

You must define reliability in terms of user expectations (especially those outlined in the Service Level Agreement) and incorporate reliability principles into the software development life cycle. For example, globally available services, where 0.01% of availability translates to hours of unplanned downtime and million-dollar losses, usually focus on server uptime. Other businesses might prioritize application response, as it affects user experience.

The Accelerate 2021 report found that companies focusing on engineering reliability get bigger benefits from DevOps. Among other things, teams who excel at modern operational practices are 1.4 times more likely to improve their software operational performance and have 1.8 more chances to get better business outcomes.

Knowing what to measure is only half the solution. You should also understand how to extract and transform data from your software development environment.

How to get more accurate DevOps metrics and measurements

Companies with multiple remote teams and cloud environments might struggle with obtaining DevOps metrics for business analysis. Here’s how you can get more valuable data for analysis.

Value stream mapping

Value stream mapping (VSM) is all about visualizing the processes in your software development pipeline. You map items and steps in every production stage to better monitor your team, identify excessive downtime, and root out things that add no value.

value stream mapping

VSM also helps you optimize your DevOps productivity. For instance, you might discover that your team wastes too much time during the handoff phase. Further investigations can reveal that poor change management is to blame. Or you may find that it’s task switching that sabotages your engineers’ productivity.

Documentation quality

We believe that this item should be one of the tops in terms of priority. If you are a startup, I bet you find adding features and hotfixes have more priority, and about 80% of clients that come to us have little to no documentation.

Proper manuals, code comments, and READMEs are your pathway toward accurate, comprehensive, and up-to-date information from your development environment. Technical documentation doesn’t have to be perfect. Even good-enough documentation will help you gather metrics faster and better.

quality documentation structure

DevOps professionals equipped with reliable documentation are 2.4 times more likely to see better delivery and operational performance. They are also 2.4 times more likely to exceed their reliability KPI expectations and 3.8 times more likely to implement robust security practices.

Is this boring? Definitely, for most engineers, it is, but once you start seeing results you understand the value of it. At that stage, it is important not to become too bureaucratic in terms of writing documents.

System observability and data analytics

Teams with good monitoring and observability are better at continuous delivery. Application monitoring software, activity logging platforms, and intrusion prevention systems are just some DevOps metrics tools your teams should use to improve their observability. Implementing an automated ETL pipeline is also a smart idea to extract, structure, and transform raw metrics into actionable insights.

Advanced monitoring tools give your teams a better understanding of the processes. They also cut troubleshooting time and help focus on actual coding. The 2021 State of DevOps report suggests that teams with robust observability practices are 4.1 times more likely to meet their engineering reliability targets.

Version control systems

Version control systems, also known as source code systems, let you track code changes by taking regular snapshots. It helps your teams work faster in a single application environment. According to the Statista 2021 research, over 21% of DevOps practitioners rely on version source code management to release code faster.

version control systems

Coordinated database change management is another critical part of DevOps. Encourage your teams to use event sourcing architecture, data partition strategy, and event logging tools to track all modifications. Another savvy idea is to establish effective communication with database administrators and carefully review all changes before updating the database.


Documentation quality

Proper manuals, code comments, and READMEs are your pathway toward accurate, comprehensive, and up-to-date information from your development environment. Technical documentation doesn’t have to be perfect. Even good-enough documentation will help you gather metrics faster and better.

DevOps professionals equipped with reliable documentation are 2.4 times more likely to see better delivery and operational performance. They are also 2.4 times more likely to exceed their reliability KPI expectations and 3.8 times more likely to implement robust security practices.

Loosely coupled architecture

Microservices, also known as loosely coupled architectures, decompose your systems into independent components. Architecture like this helps you track DevOps metrics in production and non-production deployments across services.

It also facilitates continuous delivery by allowing multiple teams to code, test, and deploy without disruptions. Microservices let developers move at their own pace, accrue less technical debt, and recover from failures of individual services much faster.

CI/CD DevOps tools

High-performing DevOps engineers use continuous integration (CI) and continuous delivery (CD) tools that automatically check release issues and deploy validated code into production. They provide immediate feedback and essential metrics. More importantly, CI/CD tools streamline coordination and reduce manual testing, improving core DevOps metrics like lead time and mean time to recovery.

GitLab’s 2021 Global Survey results show that over 75% of DevOps and DevSecOps teams use AI-powered tools and bots for code review and testing. Companies that fully leverage continuous integration and testing have a 5.8 times more chance of meeting their reliability targets.

Conclusion

Focusing on valuable DevOps metrics and KPIs is a smart way for a company to meet its goals. If your team deploys code without glitches, changes it without introducing new bugs, and keeps the systems stable 24/7 — customer satisfaction is likely to soar.

But metrics won’t do you any good without proper automation tools, analytics software, and modern operational practices in place. Only the right methodology can help you transform raw data into business insights and use it to improve your software quality, system security, and operational reliability. That’s what we at Alpacked can help you with.

Our professional DevOps agency has delivered more than 50 software solutions over the last decade. We also offer a DevOps as a Service package for companies that want to ramp up their production environment with top-of-the-line technologies and efficient development practices. Fill out this contact form to learn more about the services we offer.

Let's arrange a free consultation

Just fill the form below and we will contaсt you via email to arrange a free call to discuss your project and estimates.